 Light Learning
What it shows
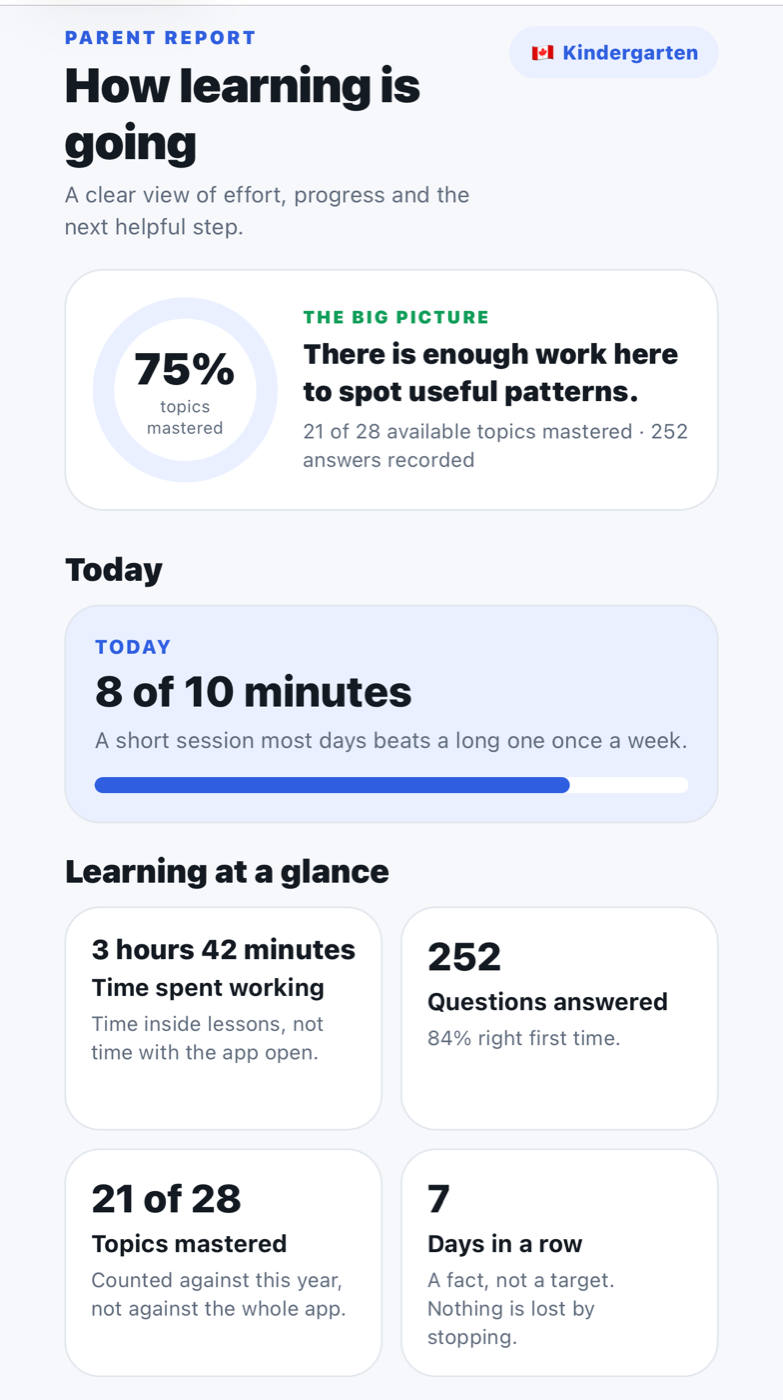
- Accuracy by subject, with the number of questions each figure came from.
- Time spent, and questions answered.
- Topics mastered, out of the number in that grade.
- The last fortnight as a chart, so a bad week looks like a bad week rather than a disaster.
- What to do next, chosen from what is being got wrong most.
Why the numbers are shown
Any report can say "your child is doing well in mathematics". That sentence is worthless without knowing it came from eleven questions. Every figure here is shown with what it was calculated from, because a parent who can see the working can tell when the app is wrong, and the app is sometimes wrong.
What it will not do
It will not tell you whether your child is gifted or behind. Those are judgements for somebody who has met them. It reports what happened in the app and stops there.
Where it lives
On the device, behind a parental gate. It is not emailed, uploaded or shared with a school unless you show it to them yourself.